

In a group of 15, 7 can speak Spanish , 8 can speak French and 3 can speak neither . What fracton of the group can speak both French and spanish?
-
ক
1/5
-
খ
4/15
-
গ
1/3
-
ঘ
7/156

ভেনচিত্র (Venn-Diagram)
জন ভেন (১৮৩৪-১৯২৩) সেটের কার্যবিধি চিত্রের সাহায্যে প্রকাশ করেন। এতে বিবেচনাধীন সেটগুলোকে সমতলে অবস্থিত বিভিন্ন আকারের জ্যামিতিক চিত্র যেমন আয়ত, বৃত্ত এবং ত্রিভুজ ব্যবহার করা হয়। জন ভেনের নামানুসারে চিত্রগুলো ভেন চিত্র নামে পরিচিত।
নিচে কয়েকটি সেটের ভেনচিত্র প্রদর্শন করা হলো :
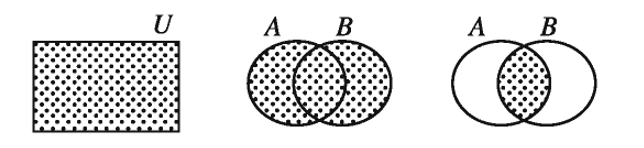
ভেনচিত্র ব্যবহার করে অতি সহজে সেট ও সেট প্রক্রিয়ার বিভিন্ন বৈশিষ্ট্য যাচাই করা যায়।
ভেনচিত্র হলো এমন একটি চিত্র যার মাধ্যমে সেটের মধ্যে সম্পর্ক, যেমন ইউনিয়ন (∪), ছেদ (∩), এবং পার্থক্য খুব সহজে বোঝানো হয়। এটি সেট তত্ত্বের একটি গুরুত্বপূর্ণ ভিজ্যুয়াল উপস্থাপন পদ্ধতি।
মৌলিক ধারণা
ভেনচিত্রে সাধারণত বৃত্ত ব্যবহার করে সেটগুলো দেখানো হয় এবং আয়তক্ষেত্র দ্বারা সার্বিক সেট (Universal Set) বোঝানো হয়।
চিহ্ন ও অর্থ
- ∪ = ইউনিয়ন (Union)
- ∩ = ছেদ (Intersection)
- U = সার্বিক সেট (Universal Set)
দুই সেটের ভেনচিত্র
ধরা যাক A এবং B দুটি সেট।
ইউনিয়ন (A ∪ B)
A ∪ B মানে A এবং B সেটের সব উপাদান একত্রে নেওয়া।
ছেদ (A ∩ B)
A ∩ B মানে A এবং B সেটের সাধারণ উপাদানগুলো।
ভেনচিত্রের ব্যবহার
- সেটের সম্পর্ক বোঝাতে ব্যবহৃত হয়
- গণিতের সমস্যা সহজে সমাধান করা যায়
- সম্ভাব্যতা (Probability) বোঝাতে গুরুত্বপূর্ণ
- ডেটা বিশ্লেষণে ব্যবহার করা হয়
উদাহরণ
A = {1, 2, 3} এবং B = {3, 4, 5} হলে,
এবং
গুরুত্বপূর্ণ ধারণা
- ভেনচিত্রে সেটগুলো বৃত্ত আকারে দেখানো হয়
- ছায়াযুক্ত অংশ দ্বারা ফলাফল বোঝানো হয়
- একাধিক সেটের সম্পর্ক সহজে বোঝা যায়
মনে রাখার উপায়
“ভেনচিত্র = সেটের ছবি” — যেখানে চিত্র দেখেই সেটের সম্পর্ক বোঝা যায়।
Related Question
View All-
ক
২৫%
-
খ
২০%
-
গ
১৫%
-
ঘ
১০%
-
ক
৩০টি
-
খ
২৫টি
-
গ
২০টি
-
ঘ
১০টি
-
ঙ
কোনটিই নয়
-
ক
১৫
-
খ
২৫
-
গ
৪০
-
ঘ
৬৫
-
ক
৩৫%
-
খ
৫০%
-
গ
২৫%
-
ঘ
৩০%
-
ক
১
-
খ
২
-
গ
৩
-
ঘ
৪
-
ক
0
-
খ
7
-
গ
10
-
ঘ
14
১ ক্লিকে প্রশ্ন, শীট, সাজেশন ও
অনলাইন পরীক্ষা তৈরির সফটওয়্যার!
শুধু প্রশ্ন সিলেক্ট করুন — প্রশ্নপত্র অটোমেটিক তৈরি!
Related Question
Complete Exam
Preparation
Learn, practice, analyse and improve
Question Analytics
মোট উত্তরদাতা
জন